Trading Talks GOLD Oct 04
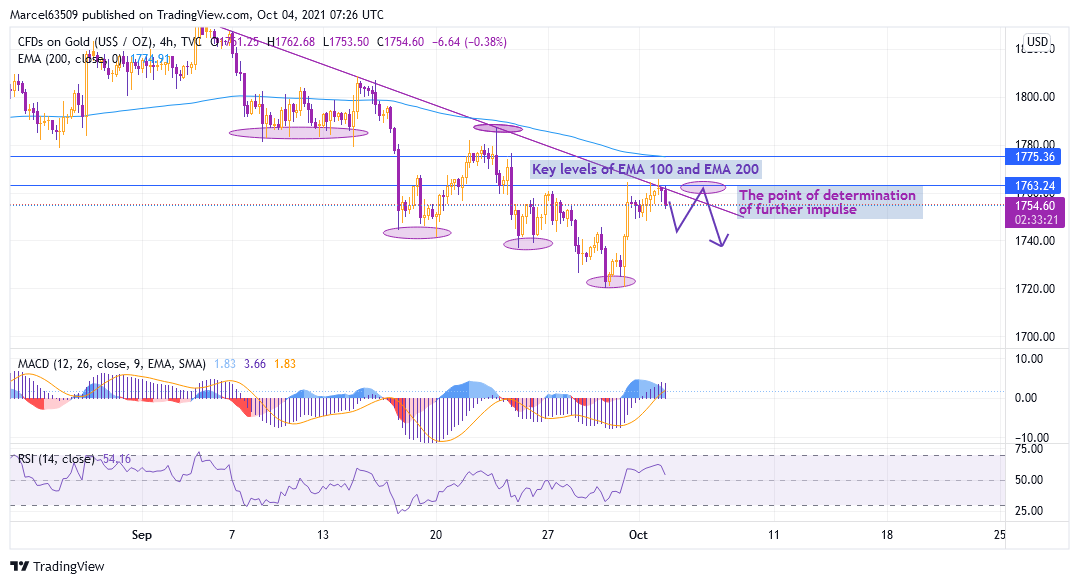
On the one hand, the Daily chart shows a MACD buy signal and a reversal of the current downtrend. But at the same time, the price stopped at the EMA 100 on the four-hour chart and this will be a key level for determining further movement, since it coincides with the area where the downtrend channel creates resistance.
Probably today we will see the continuation of the fall according to the trend, but after reaching 1740, the price may turn around to retest the trend resistance. This will give an opportunity to buy cheaper if the buy signals are clear. The key levels for building a trading plan are 1737 and 1720 in case of trend continuation, 1775 and 1785 in case of resistance breakdown.


