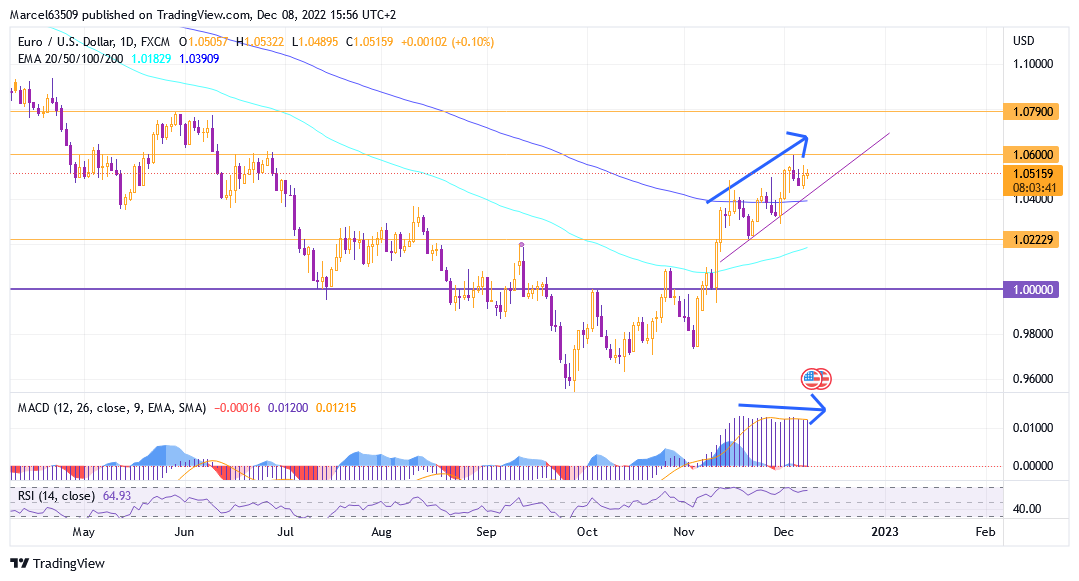
EUR/USD trading talks December 08
In a previous post I wrote that there are some preconditions for a further fall as part of the formation of a rectangular correction. This analysis was not 100% accurate, but there was still a drop as I said according to the 1.03460 marker level and MACD data that preceded the decline to 1.02900, almost touching the EMA 100 on the 4 hour chart.
But at the same time, I also mentioned an interesting growth option and focused on it. I said that breaking through the EMA level of 200 daily will signal growth within the correction. Also, I mentioned the 1.04870 level as a marker for further growth, with the possibility of reaching 1.06000. As you can see, this is what happened.
For now, exactly 1.06000 will become the key resistance for further growth to 1.06300 and even the resistance area of 1.07800 in the long term. And on the daily chart, the situation with breaking through the EMA looks quite convincing.
But it’s also important to remember that confirming indicators can make a big difference. So, with each new top of the current trend on the four-hour chart, the MACD divergence is getting stronger, as well as the MACD divergence on the daily chart. This means that the price may fall even now in case of breaking through the support of 1.04460, the EMA 100 level on the four-hour chart, which coincides with the daily EMA 200 at 1.03900 and slide to EMA 200 and the support level of 1.02230.


