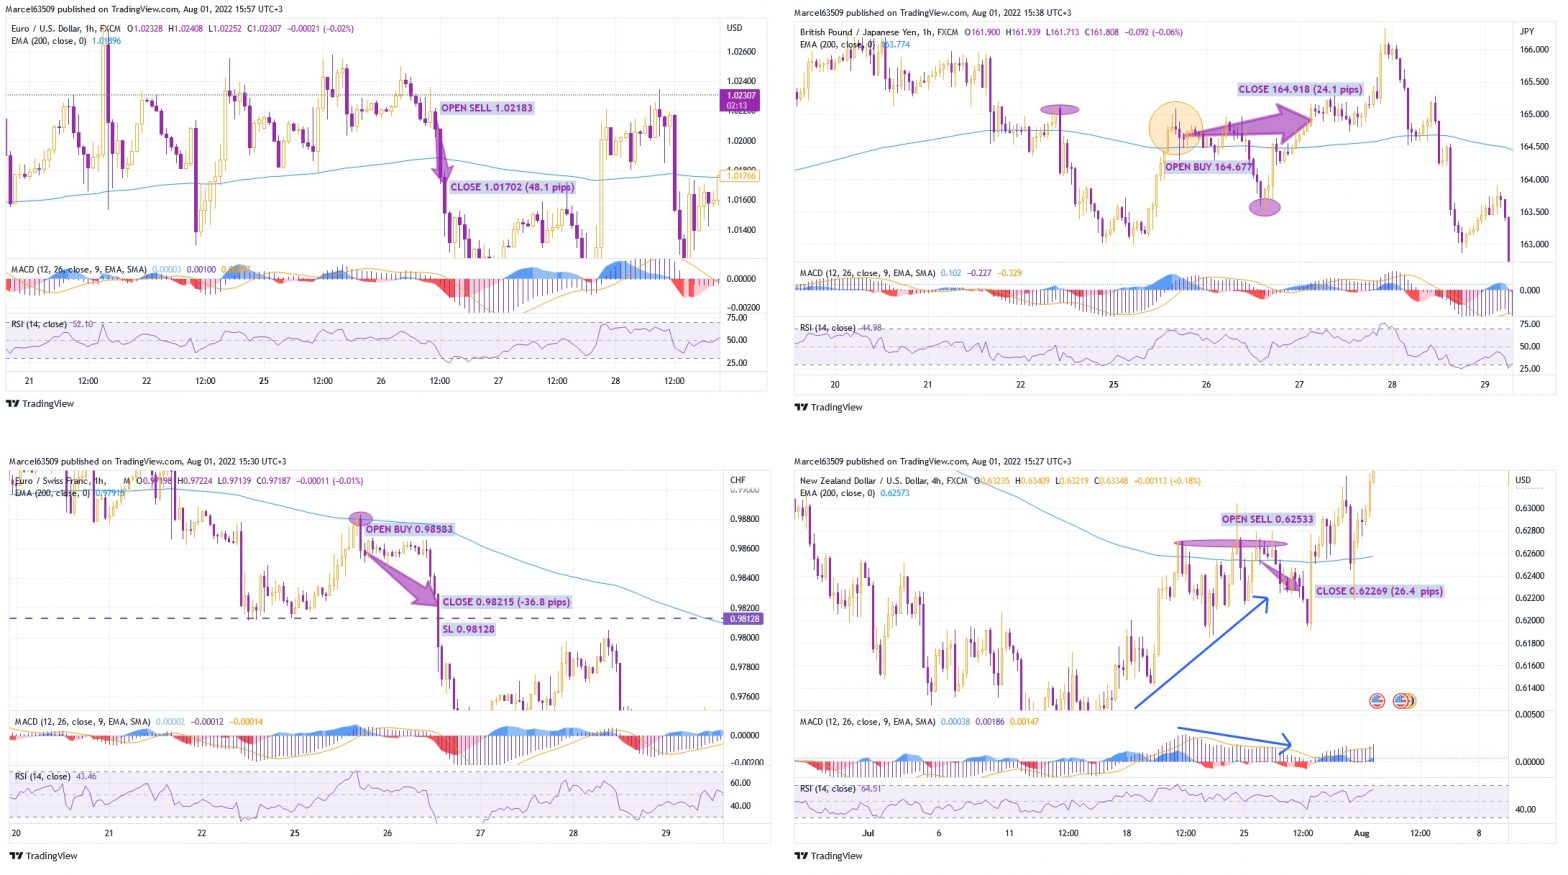
Trading profit / loss analysis of 4 latest trades
Analysing trades over the past week has shown some interesting facts that I would like to share. These trades showed the imperfection of the trading system, and also, will allow me to continue working on the mistakes that I managed to find.
The list of trades:
- Euro Franc (buy 0.98583)
- Pound Yen (buy 164.677)
- New Zealand dollar US dollar (sell 0.62533)
- Euro Dollar (sell 1.02183)
eur/usd sell trade was closed manually, at a price 1.01702.
Honestly, I regret that I closed the trade too early, because the EMA 100 and EMA 200 clearly showed a further fall, but I was afraid of a false break, as well as the impact of key support 1.01600 (which was also broken soon) and did not risk the funds that I have already been obtained. The opening of the trade was confirmed clearly according to the MACD data on the four-hour and hourly charts.
eur/chf buy was manually closed at 0.98215
although the stop loss was set lower at 0.98128.
This trade was based on a market analysis I posted here: https://luxsystem.trade/2022/07/25/euro-franc-has-tested-the-low-of-0-98100/
I got MACD confirmation on the 4-hour chart, and there were no preconditions for a sell signal on the 1-hour chart. It was necessary to pay attention to the false breakdown of the EMA 200 on the hourly chart, although the EMA 100 was already below. Since I saw that the currency pair was going into a long fall according to the MACD, EMA and the formed down channel, I decided not to wait for the stop loss to be reached, which was the right decision, as you can see on the chart.
gbp/jpy buy was manually closed at 164.918
after a long drawdown that I had to wait out.
I opened a trade according to the MACD data, after breaking through the EMA 200 on the hourly and four-hour charts. If I had held during July 27, I could have taken profits around 166.00, but I decided not to take risks and closed the trade before the key resistance at 165.100. It was a hasty decision, due to some tension that had arisen during the drawdown earlier. The MACD and EMA provided clear enough data to trade further, but I didn’t use them.
nzd/usd sell manually closed at 0.62269.
The main factor that pointed me in the direction of this trade was the divergence on the four hour chart. Also, I saw some consolidation in the EMA 200 area, which indicated that the market is not ready for a breakout and this is a sign of further uptrend correction. This is one of the few trades I have ever traded from the top of an uptrend knowing that it could be dangerous if the channel widened.
Watch trading history and trades online on myfxbook:


