

GBP/JPY trading talks May 25
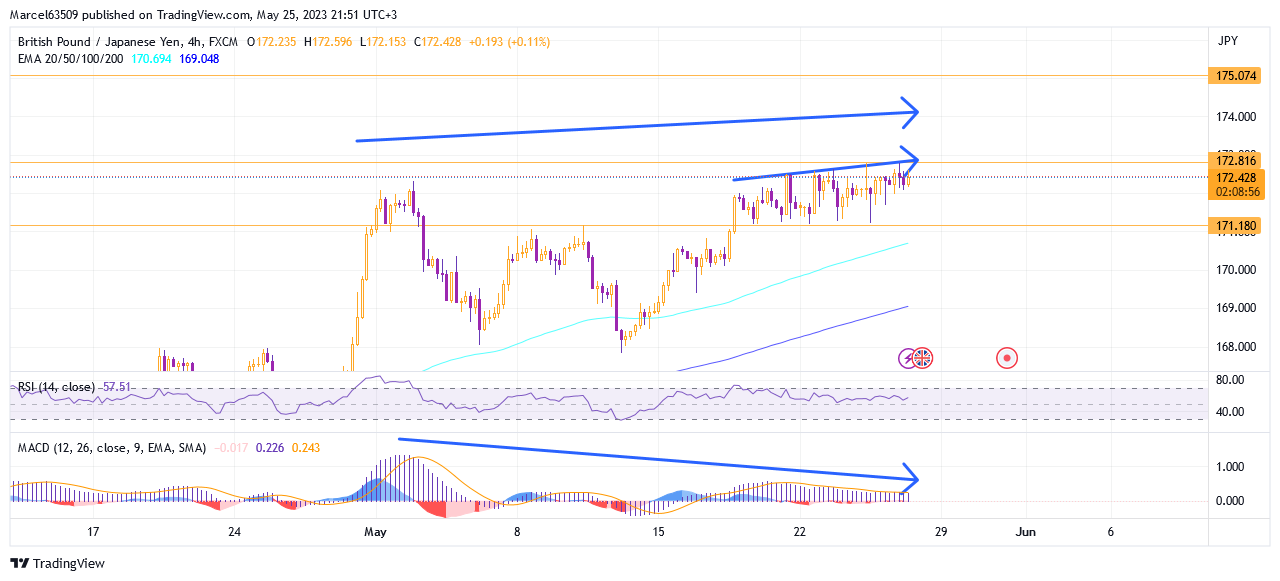
GBP/JPY is once again reaching the resistance of 172.800 and in my opinion does not have strong priorities for further growth for a while. The current area of resistance puts strong pressure on the market and during May this level was not passed. I will consider this level as a marker and further growth can be considered only after it is broken. However, in the long term (weekly and monthly) MACD and EMA point to buy.
On the short term charts, I see a MACD divergence that formed during a horizontal move along resistance, with a slight bullish incline.
In order to consider further downside, I would take a close look at the hourly chart which indicates MACD sell but the EMAs are still below the price level which provides some support and a fall could be considered if the EMA 100 marker level is passed on the hourly chart (now at 172.015) and further breaking through the EMA 200 line with the prospect of falling to 171.250 (still within the current horizontal trend).
Summing up, I would clarify that the short term hints at a fall following the divergence and the impact of the 172.800 resistance, but the long term, where the monthly chart shows a preliminary MACD buy signal, can still return to a continuous increase, which can be strong enough to reach 175.00.
