

EUR/JPY trading talks April 08
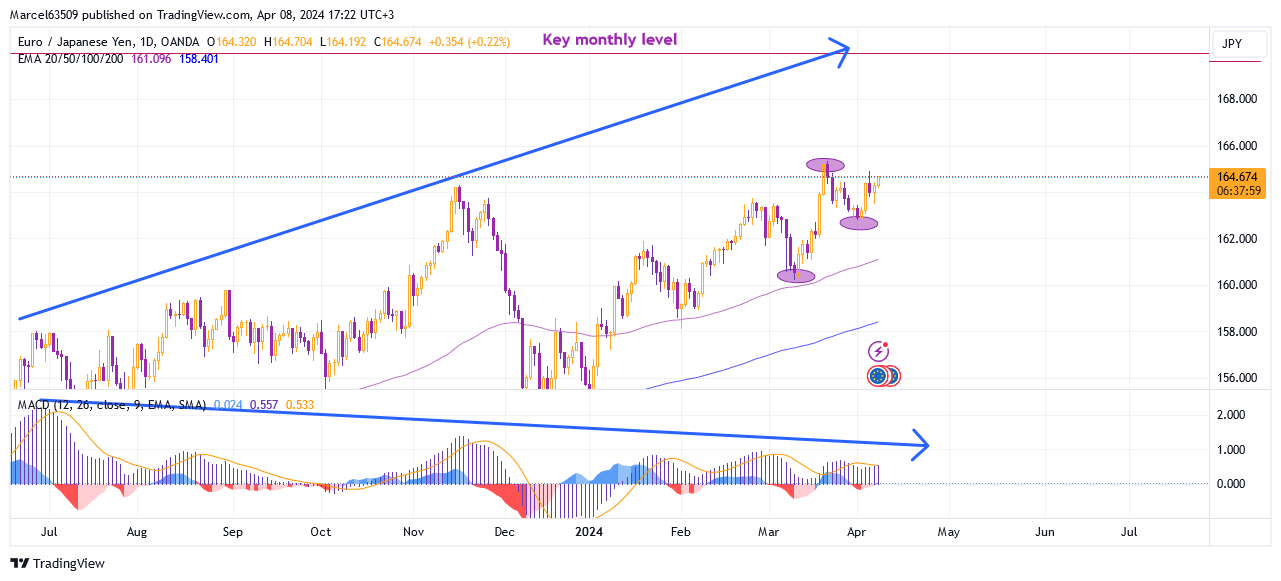
Long-term analysis of the EUR/JPY shows a clearly visible divergence, each new high of the current uptrend reaches lower values on the MACD. However on the monthly chart the clear convergence is formed and the key level of 170.00 (which was previously reached in 2008) is seen as a target for further growth.
This distribution of indicators suggests that:
- Before a new attempt to reach 170.00 within the current global trend, the correction is highly possible.
- On lower time frames the market will test the current local maximum of 165.350
- In case of 165.350 confidently broken, then the divergence will probably continue and the fall will be started from the level 170.00
- If the local maximum is not broken and the price begins to fall, then it is probably the start of the correction, which could continue to 162.700 and lower to the daily EMA 100 and key support 160.300.
In this situation, it is also important to note that on the four-hour chart the price level is paced higher than EMA 100 and EMA 200 lines, which is a signal of further growth. The marker levels to pay attention to in case of buy are: 165.00 and 165.350, in case of sell are: 163.500 (coinciding with the four-hour EMA 100) and 162.700 (in the area of influence of the EMA 200).
I will continue to monitor the situation on EUR/JPY and am going to enter the market to catch movements on the hourly and four-hour charts between the marker and key levels that I indicated.
