

BTC/USD trading talks April 18
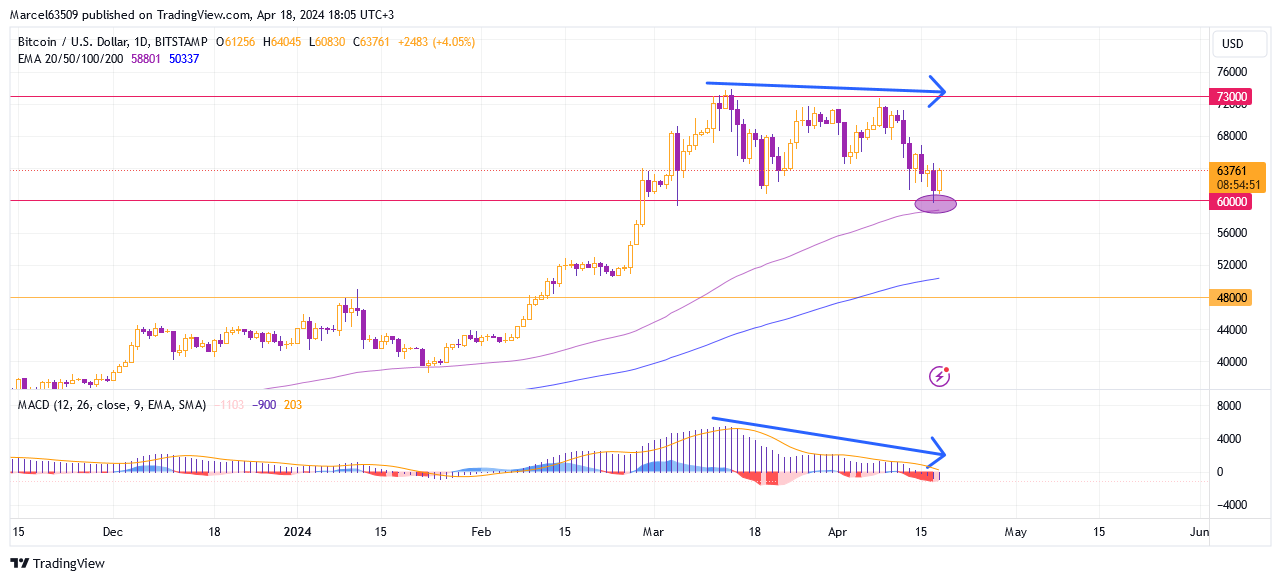
The current Bitcoin fluctuations is part of a correction that has a horizontal channel between the key levels of 60K and 73K. At the same time, on the daily chart it is clear that the level of 60k is strengthened by the influence of EMA 100, but with some divergence and the prospect of MACD entering the zone of negative values.
The weekly chart shows pure convergence and a preliminary increase in the probability of crossing the signal line as a sell signal. Thus, if the 60k level is broken below, then I will expect a likely further decline to 50k, where the daily EMA 200 line has been formed and also the key support of 51k, which will prevent the decline.
But in the short term, I see that growth is also possible, at least within the current horizontal channel with the initial marker level at 65k. Moreover, the four-hour MACD shows initial signal to buy. In case of 65k level breaking through the level of previously maximum point 73k may be a significant resistance for further growth of BTC. And further 73k level passing will open up new prospects for Bitcoin and make it possible to realize the potential for maximum historical values, but I suppose that for now it is quite moderate (75-80k).
I see prospects for further growth within the horizontal channel, but I suggest keeping an eye on the marker and key levels of 60k and 73k, a breakthrough of which will mean a unidirectional movement.
