

EUR/USD trading talks April 11
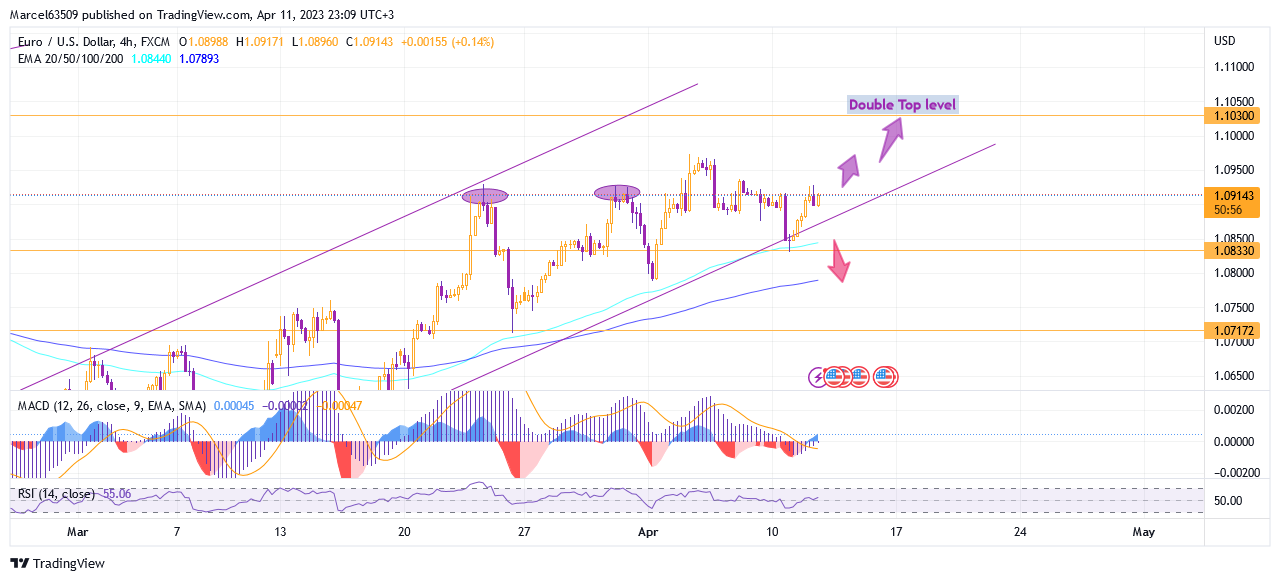
My previous analysis of the EUR/USD pair had some upside bias and a likely double top formation from 1.10300. But this week the market, having some volatility, tested the EMA 100 level on the four-hour chart (1.08330) that I also mentioned and returned to the level of 1.09100. Thus, the current uptrend has not been broken, and the growth option is still among the possible ones in the near future. The 1.09730 top level is a resistance, and it will have an impact on the price in case of growth. I will consider the level 1.09300 as a marker level for further growth to the nearest resistance 1.09730. At the same time, further growth will mean a probable achievement of 1.10000 and 1.10300. In order to see possible decline options, I would again pay attention to the fact that the EMA lines on the hourly chart are very close below the price line and can probably provide support, but if they are broken, I would consider a second possibility of falling to 1.08330. This is a marker level, which will show the prospect of further fall, or continuation of fluctuations within the horizontal channel 1.09300 – 1.08330.
Looking more closely at the hourly chart, I see that the next support is at the EMA 100 line at 1.08970 and the following at EMA 200 1.08850.
The MACD shows a preliminary buy signal on hourly. On the four-hour MACD chart, the signal line crossing is quite clear and shows a predisposition to growth.
