

EUR/USD trading talks April 17
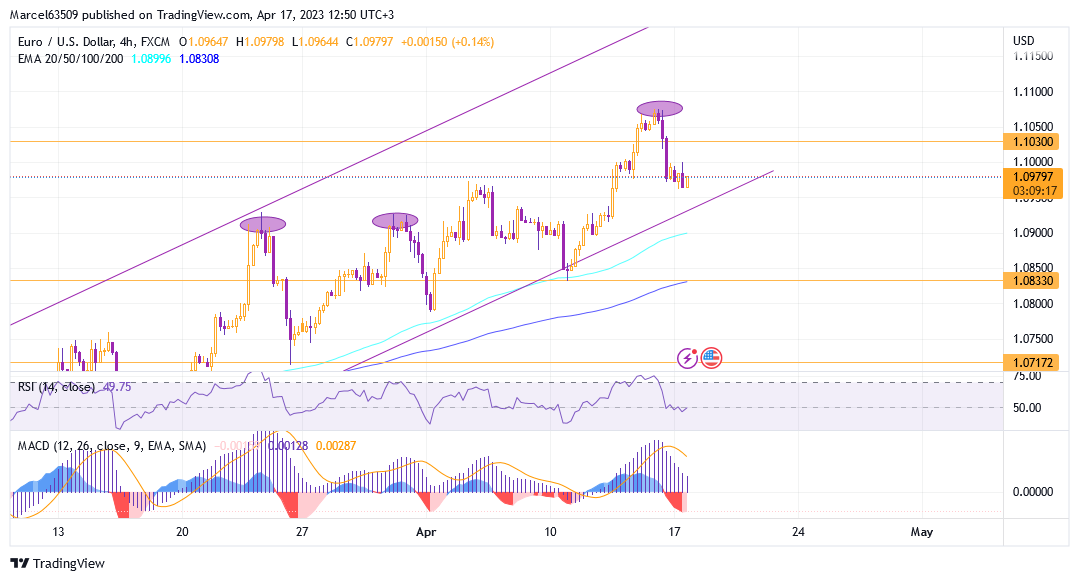
Euro Dollar reached the level of 1.10300 and even formed a new high at 1.10750, which will be a key resistance level for further growth and continuation of the uptrend. Now, the market is fluctuating inside the uptrend channel on the four-hour chart.
On the hourly chart, the price has already crossed the EMA 100 during a local correction, but is still above the EMA 200. This position provides me with the 2 marker levels at EMA lines on the hourly chart (1.10000 and 1.09500) for further movement. The MACD on the hourly chart shows a weak buy signal as well as a slight divergence that is better visible on the 30 minutes chart.
On the 4 hour MACD chart, there is a strong sell signal and the RSI is fluctuating around the 50 area, indicating that the market is temporarily uncertain. The divergence that was forming earlier was partially broken by the recent growth, but I will continue to take it into account, because it can be broken or continued with further market movement.
The chart shows an uptrend that is currently active and can be continued. But if the formation of the double top continues and the sell signals are confirmed, then this trend will be broken. Also a very important aspect is the presence of several support levels: 1.09200, 1.09000 (now EMA 100 on a four-hour chart) and 1.08330 (now EMA 200 on a four-hour chart).
Preliminarily, I estimate this situation as prone to short-term growth with a possible test of 1.10300 and even 1.10750. But after that, a fall will form, which may lead to a violation of the current trend. I have set marker and key levels that I will rely on while trading.
