

EUR/USD trading talks January 24
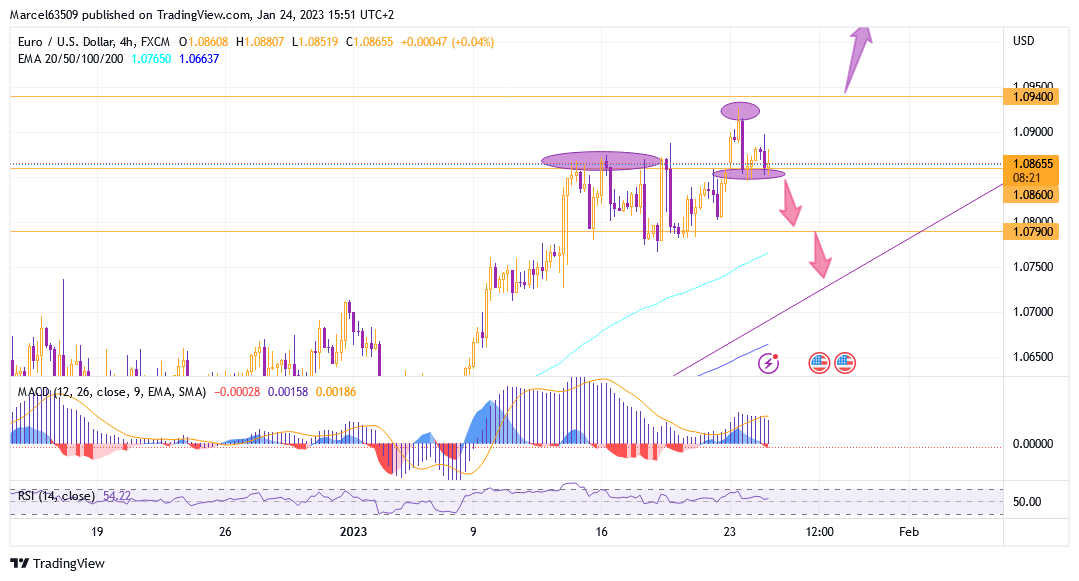
In a previous analytics post, I wrote about a possible short-term fall, after which growth to the level of 1.09400 is likely to resume. As you can see, the chart reached the EMA 100 line on January 18 and after that it started rising to 1.09267, breaking through the key level of 1.08600.
The current situation on the market again hints at a temporary decline. I see a divergence and a MACD signal line crossing on the daily chart. Moreover, the divergence is also visible on the 4-hour chart, also with a clear signal line crossing.
The current correction on the hourly chart was formed on the support level of 1.08600 basis, I mark it as a preliminary marker level for further decline, and the EMA 100 line on the hourly chart as a key signal level to reach EMA 200, which is now at 1.08200. I also noted that there is a possibility of falling to the trend support level, but such a scenario will be more specific if the price can break through the supports of 1.07900 and 1.07700.
Marker level for growth in the short term is 1.08860, but this may be more of a movement within the horizontal corrective trend, which can also be extended to a key level of 1.09400.
